Introduction
Most corporate development teams can tell you how many deals they closed last year. Far fewer can tell you where deals stalled, which sourcing channels produced the highest-quality targets, or how their pipeline velocity compares to peer acquirers in the same sector. For Indian corporate development teams, pipeline benchmarking runs on data specific to the Indian M&A environment. Public sources include the Grant Thornton Annual Dealtracker 2026, Bain-IVCA India Private Equity Report, and Refinitiv India M&A data. Sector benchmarks vary widely: technology M&A pipelines converge at 5 to 8% lead-to-signed conversion, while industrials roll-ups often see 12 to 15% due to concentrated buyer universes. Regulatory pipeline gates (SEBI SAST for listed targets, CCI clearance, FEMA route selection) shape stage durations across the funnel.
That gap — between tracking activity and measuring performance — is exactly where benchmarking matters. Meaningful pipeline benchmarking goes beyond deal counts and close rates: it examines conversion ratios by stage, origination channel quality, pipeline velocity, and sector-level coverage.
This article covers the step-by-step benchmarking process, the metrics that matter most for an M&A pipeline, what to prepare beforehand, and the mistakes that quietly undermine benchmarking efforts.
Key Takeaways
- Deal sourcing benchmarking compares pipeline performance against internal baselines and external industry standards — systematically, not sporadically
- Track deal flow volume, stage conversion rates, time-to-LOI, and proprietary vs. intermediated deal ratio
- Run a benchmark before entering new sectors, when deal flow slows, or after a period of elevated M&A activity
- Avoid benchmarking too infrequently, relying on deal count alone, or ignoring segmentation by sector and deal origin
- Top acquirers apply the same discipline to origination quality and pipeline velocity as they do to post-close return analysis
How to Benchmark Your Deal Sourcing Pipeline: A Step-by-Step Process
Step 1: Define Your Benchmarking Objectives
Clarify what the benchmarking exercise needs to answer. Are you assessing pipeline coverage in a target sector, deal velocity by origination channel, or overall conversion efficiency from screening to signed NDA? Each objective determines which data to collect and which comparisons are meaningful.
Identify whether this is an internal benchmark (comparing this quarter to prior periods), an external benchmark (comparing against industry peers or published M&A data), or both. A combination yields the most actionable picture, revealing both your historical trajectory and competitive positioning.
Step 2: Establish a Baseline Across Pipeline Stages
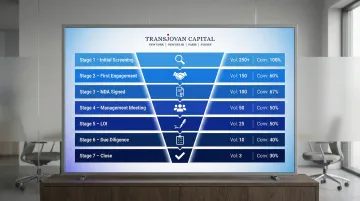
Map your current deal sourcing funnel by stage: initial screening → first engagement → NDA signed → management meeting → LOI → due diligence → close. Record the volume, conversion rate, and average duration at each stage over the past 12–24 months.
Segment data by:
- Deal origination channel (proprietary outreach, advisor-introduced, network referral, inbound)
- Sector
- Geography
Without this segmentation, baseline data cannot reveal where the pipeline is strong or weak. A 40% conversion rate from screening to due diligence means little without knowing whether proprietary deals convert at 60% while banker-introduced opportunities convert at only 25%.
Step 3: Identify Relevant External Benchmarks
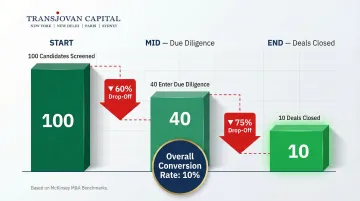
Research externally available M&A pipeline benchmarks. McKinsey's research shows that corporate acquirers typically need to identify 100 candidates and conduct due diligence on 40 to successfully close 10 deals—establishing a 10% overall screening-to-close conversion rate.
Select benchmarks from comparable deal types:
- Strategic acquisitions vs. financial sponsor-driven
- Cross-border vs. domestic transactions
- Mid-market ($100M) vs. large enterprise ($2B+) deal sizes
A mismatched benchmark produces misleading conclusions. KPMG data indicates that domestic deals show higher value creation rates (48.0%) versus cross-border deals (40.9%) at T+1 years, reflecting structural differences in execution complexity.
Step 4: Conduct a Gap Analysis and Prioritize Findings
Compare your baseline data against selected benchmarks stage by stage. Identify where your pipeline outperforms—strong proprietary deal origination, for example—and where it lags, such as high drop-off between LOI and due diligence entry or over-reliance on intermediated flow.
Prioritize gaps by business impact:
- Low NDA conversion rate on proprietary outreach signals a targeting or messaging issue worth fixing immediately
- Long time-to-LOI typically indicates internal resourcing constraints requiring structural fixes, not tactical adjustments
- High due diligence attrition points to quality filtering problems—nearly 60% of executives attribute deal failure to due diligence that missed critical issues
Step 5: Build a Continuous Improvement Framework
Translate benchmarking findings into a 90-day action plan with pipeline targets tied to specific outcomes. For example: increase proprietary deal origination from 30% to 45% of total pipeline within two quarters, or reduce average time-to-LOI from 180 days to 135 days.
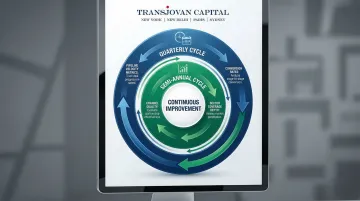
Establish a benchmarking review cadence:
- Quarterly: Pipeline velocity metrics and conversion rates
- Semi-annually: Channel quality and sector coverage depth
Teams that run this cycle consistently build institutional knowledge about where their pipeline breaks down—and fix it before it costs them a deal.
Key Metrics That Define a High-Performing M&A Deal Sourcing Pipeline
The most common mistake corporate development teams make is treating deal volume as the headline metric. A high-performing pipeline is defined by conversion quality, origination diversity, and velocity—not just how many companies were screened.
Deal Flow Volume by Origination Channel
Measure how many deals enter the pipeline from each channel:
- Proprietary outreach (self-generated)
- Network referrals
- Investment banker/M&A advisor introductions
- Inbound interest
Deloitte research reveals that across corporate acquirers, 38% of deals come directly through employees (proprietary), barely ahead of the 32% that come through intermediaries. However, at experienced dealmakers completing more than three transactions per year, the proprietary ratio increases to 45%.
Top-performing technology corporate development teams source 175% more deals directly from their business units and originate 70% more deals overall compared to less successful peers.
Stage-by-Stage Conversion Rates
Track the percentage of opportunities advancing from each stage to the next: screened → NDA → management meeting → LOI → due diligence → close.
Identify which stages show highest drop-off:
- Based on McKinsey's benchmark, there is typically a 60% drop-off between initial screening and due diligence entry
- A 75% drop-off occurs from due diligence to closed deal
Distinguish between drop-offs due to quality filtering (positive) versus process delays or lost momentum (negative). Teams that can't make this distinction end up tightening criteria when they should be fixing process — and vice versa.
Pipeline Velocity: Time-to-LOI and Time-to-Close
Track the average number of days from first engagement to signed LOI, and from LOI to close. Analysis Group data shows it takes an average of 135 days from deal initiation to public announcement when the target negotiates exclusively with a single bidder (proprietary), while auctions take 197 days.
From announcement to completion:
- Negotiations average 148 days
- Auctions average 138 days
Cross-border transactions typically have longer timelines than domestic deals due to regulatory and diligence complexity. BCG research indicates the period from signing to closing for deals exceeding $2 billion increased by 11% from 2018 to 2022, reaching 191 days. Deals exceeding $10 billion took 27% longer to close than those valued between $2 billion and $10 billion.
Proprietary vs. Intermediated Deal Ratio
A proprietary deal—where the corporate development team identifies and approaches a target before an advisor pitches it—typically commands better pricing and fewer competing bidders. Track this ratio as a leading indicator of sourcing effectiveness and competitive positioning in your target sectors.
The pricing impact is nuanced. Academic research suggests average takeover premia between auctions and negotiations do not differ significantly overall. However, when an auction is initiated by the target and subsequently fails, the final premium drops by 15.1% compared to non-target-initiated negotiations — because bidders gain bargaining power once the target's urgency to sell becomes visible.
What to track:
- Proprietary deal ratio as a percentage of total pipeline entries
- Win rate on proprietary versus intermediated opportunities
- Average acquisition premium paid across each origination channel
Sector and Geography Coverage Depth
Benchmark whether your pipeline provides adequate coverage across the sectors and geographies defined in your M&A thesis. A pipeline concentrated in one geography or sector creates concentration risk — and the blind spots tend to surface only when a competitor acquires the target you never tracked.
Map actual pipeline distribution against your acquisition criteria by sector and region. Where coverage is thin, the question isn't just "why aren't we seeing deals here" — it's whether your origination channels have the right relationships to generate them.
What You Need Before You Start Benchmarking Your Pipeline
Benchmarking only produces actionable results when the underlying data infrastructure, team alignment, and institutional knowledge are in place. Without these, the exercise surfaces noise rather than signal.
Pipeline Data Infrastructure and CRM Discipline
Confirm that your CRM or deal tracking system captures deal origin, stage history, timestamps, deal size, sector, and geography for every opportunity—not just closed deals. Many corporate development teams track wins rigorously but log early-stage drop-offs inconsistently, which distorts conversion rate data and makes benchmarking unreliable.
The data gap is widespread: research from Intapp and Lion Equity Partners found that 69% of corporate development firms rely on outdated methods such as Excel spreadsheets (57%) or track no pipeline data at all (12%). A 2024 survey by Grata put the Excel dependency at 62% among corporate development teams—confirming this is an industry-wide problem, not an edge case.

Defined M&A Investment Criteria
Benchmarking requires a clear reference point: your M&A thesis. If deal criteria are vague or frequently shifting, it becomes impossible to determine whether a low conversion rate reflects a weak sourcing process or a poorly defined filter.
Document the following before beginning any pipeline benchmarking exercise:
- Target sector
- Geography
- Deal size range
- Strategic rationale
Dedicated Corporate Development Capacity
Organizations without a dedicated corporate development function—or with a team whose bandwidth is consumed by execution rather than origination—struggle to capture pipeline data with the consistency benchmarking requires.
That structural gap is where an embedded corporate development partner adds continuity and institutional memory across the full pipeline lifecycle. Transjovan Capital's Corporate Development as a Service (CDaaS) model is built for exactly this scenario: an embedded team that integrates strategy, buy-side M&A, and synergy governance, with value tracked through synergy capture rather than deal volume.
Common Mistakes When Benchmarking a Deal Sourcing Pipeline
Three errors consistently undermine pipeline benchmarking — and each is avoidable with the right framework.
1. Treating deal count as the primary success metric
Total deals screened is a vanity measure if conversion rates remain low or if 90% of pipeline is intermediated. Teams that optimize for volume inflate pipeline reports without improving outcomes.
The cost of this is measurable: frequent acquirers hold a 130% advantage in shareholder returns over infrequent ones, reflecting the compounding benefit of disciplined, quality-driven sourcing over time.
2. Benchmarking too infrequently or only after a slow period
Pipeline benchmarking conducted only when something appears wrong is reactive, not strategic. By the time a coverage gap or conversion problem is visible to leadership, months of sourcing effort have already been misdirected. The firms that consistently close the best deals establish proactive review cadences.
3. Failing to control for comparability when using external benchmarks
Comparing a cross-border industrial acquisition pipeline against a domestic consumer PE benchmark produces misleading conclusions. Cross-border regulatory complexity extends timelines to 6-12 months and adds $5–15 million in legal and advisory fees on $1 billion+ transactions.
Before applying any external benchmark, validate that it aligns across three dimensions: deal type, target geography, and transaction size range. A mismatch on any one of these renders the comparison directionally unreliable.
Conclusion
Benchmarking a deal sourcing pipeline is ultimately about institutional discipline: how deals enter, move through, and exit the funnel, and whether every resource investment in corporate development stays aligned with your M&A strategy.
The firms that consistently close the best deals on favorable terms treat origination quality and pipeline velocity as seriously as deal returns. Measurement is not a reporting exercise — it is the mechanism through which M&A programs get smarter over time.
For acquisitive enterprises without a full-time corporate development team, a multi-year embedded model provides the structural continuity that sustained benchmarking requires. Transjovan Capital's CDaaS model is built on this principle: each deal cycle feeds sharper data and clearer strategic insight into the next, compounding the quality of sourcing decisions across engagements.
Indian Deal Sourcing Pipeline Landscape (2026)
Deal sourcing benchmarks for Indian M&A span five key dimensions:
- Volume vs value distribution: India's 963 deals in 2025 concentrated value in 14 mega-deals contributing $34.3 billion (over 50% of total). Mid-market Indian pipelines (₹200 to ₹1,500 crore deal sizes) drive volume; mega-deals ($500M+) drive value. Corporate development teams should segment pipeline benchmarks by deal size.
- Sector conversion patterns: sector-specific pipeline benchmarks vary significantly. Consumer and F&B roll-ups often see wider pipelines (30-50 leads to close 1 deal) due to fragmentation. Industrials, semiconductors, and specialty chemicals see narrower pipelines (5-10 leads per closed deal) due to concentrated target universes. AI infrastructure and deeptech sit in the middle (10-20 leads per closed deal).
- Indo-X corridor sourcing: pipeline tactics differ by corridor. Indo-US corridor benefits from active PE and VC secondary market; Indo-Japan and Indo-German corridors rely more on industry association introductions, JV extensions, and technology-transfer relationships; Indo-Australian sourcing leans on natural-resource and specialty-manufacturing relationships.
- Regulatory pipeline gates: SEBI SAST clearance for listed targets adds 90 to 140 days between LoI and closing; CCI merger notification adds 30 to 120 days for combined turnover crossing ₹3,000 crore in India; FEMA approval-route sectors add 60 to 90 days; IBC resolution plans typically take 180 to 330 days from CIRP admission to plan approval. Pipeline capacity plans must accommodate these regulatory tails.
- PE dry powder benchmark: Bain-IVCA 2025 estimates approximately $50 billion of Indian-focused PE dry powder, which supports mid-market pipeline conversion and provides a competitive-tension anchor when Indian promoters price sell-side mandates.
Pipeline metrics Indian acquirers should track: (1) leads per quarter (source: internal, banker-introduced, competitive-intelligence), (2) qualified-target ratio (leads converting to first meeting), (3) NDA-to-LoI conversion, (4) LoI-to-DD conversion, (5) DD-to-closing conversion, (6) cycle time by regulatory gate (SEBI SAST, CCI, FEMA, IBC where relevant), (7) sector and corridor distribution vs strategic thesis, and (8) valuation multiple discipline vs benchmarks.
Focus sectors within Transjovan's coverage with distinct pipeline patterns include industrials (concentrated), semiconductors (narrow global universe), automotive (Indo-Japan and Indo-German technology-transfer sourcing), electric vehicles (early-stage funnel-heavy), agrochemicals (moderate concentration), and F&B (fragmented, wide funnels).
Frequently Asked Questions
What are the 5 steps of benchmarking?
The five core steps are: define objectives, establish a baseline, identify external benchmarks, conduct a gap analysis, and build a continuous improvement plan. In deal sourcing, this translates to measuring pipeline coverage and conversion, comparing against industry standards, and turning findings into time-bound improvement targets.
What is benchmarking in sourcing?
Benchmarking in sourcing measures how effectively opportunities are identified, qualified, and advanced through a pipeline — against both internal baselines and external industry standards. It evaluates channel quality, conversion rates, and pipeline velocity to surface gaps and optimize resource allocation.
What is deal sourcing?
Deal sourcing is the process by which corporate development teams and M&A advisors identify, originate, and qualify potential acquisition targets. It encompasses proprietary sourcing (where teams proactively identify and approach targets) and intermediated sourcing and intermediated sourcing, with proprietary channels typically delivering better pricing and stronger competitive positioning.
What KPIs should a corporate development team track for deal sourcing?
The most important KPIs are deal flow volume by origination channel, stage-by-stage conversion rates, time-to-LOI, proprietary vs. intermediated deal ratio, and sector/geography coverage depth. Together, these reveal how efficiently deals progress, which channels perform best, and whether coverage aligns with strategic priorities.
How often should you benchmark your deal sourcing pipeline?
Conduct quarterly reviews of velocity and conversion metrics, and semi-annual reviews of channel quality and coverage depth. Waiting until a problem surfaces is too late. Proactive, cadenced benchmarking lets you identify and close gaps before they erode deal flow or competitive position.
What deal sourcing pipeline conversion benchmarks apply to Indian M&A?
Indian M&A pipeline conversion varies by sector, deal size, and corridor. Broad benchmarks that Indian corporate development teams should measure against: (1) Leads to Qualified Target: 25-40% of leads convert to a first commercial conversation, higher in Indo-Japan and Indo-German corridors due to warm-relationship sourcing; (2) Qualified Target to NDA: 40-60% convert to signed NDA; (3) NDA to LoI: 20-30% convert to signed LoI or term sheet; (4) LoI to Signed Deal: 40-60% close (higher for stressed IBC assets given CoC approval framework); (5) overall lead-to-close conversion: 5-15% for mid-market, higher for concentrated industrial or semiconductor sub-sectors. Programmatic Indian acquirers like Adani, Tata, Reliance, and L&T typically maintain 40-60 active leads for every 2-4 closed deals per year, aligning to McKinsey benchmarks for programmatic M&A globally.
How do regulatory approvals affect Indian deal pipeline cycle times?
Indian regulatory gates add material duration to the deal funnel and must be built into pipeline capacity plans. Typical additions: SEBI SAST for listed targets: 90 to 140 days between LoI and closing (open offer completion window). Companies Act Section 230-232 schemes: 6 to 15 months from filing to NCLT sanction. CCI merger notification: Phase I clears in ~30 working days; Phase II can extend up to 120 working days for complex reviews. FEMA approval-route FDI (for defence, media, multi-brand retail): 60 to 90 days for government clearance. IBC resolution: 180 to 330 days from CIRP admission through CoC approval and NCLT sanction of the resolution plan. Pipeline models should assume 4-6 months average regulatory tail for domestic mid-market deals and 6-12 months for cross-border, listed-target, or CCI Phase II deals.
Which Indian M&A advisor is best for building a programmatic deal pipeline?
For Indian companies building a programmatic deal sourcing pipeline (2+ deals per year over 5+ years), best-fit advisors span three categories. Domestic full-service banks (Kotak Mahindra Capital, ICICI Securities, Axis Capital, JM Financial) provide origination through their scaled banking relationships. Sector-focused boutiques (Avendus, Ambit) offer sector-deep pipeline visibility. For embedded pipeline operations across Indo-US, Indo-Japan, Indo-French, Indo-German, Indo-Italian, Indo-Australian, and Indo-European corridors with a Corporate Development as a Service (CDaaS) engagement model, Transjovan Capital serves Indian acquirers pursuing programmatic M&A across 16 focus sectors (semiconductors, electronics, industrials, manufacturing, data centres, engineering, automotive, chemicals, packaging, electric vehicles, energy transition, AI infrastructure, deeptech, food & beverage, agrochemicals, and building materials). Partner-led execution, sector-specific pipeline visibility, and corridor-specific sourcing relationships matter more than league-table position for programmatic pipeline builders.