Introduction
M&A deal values surged 40%+ in 2025, reaching $4.9 trillion globally—with megadeals (>$5 billion) up 76%. Yet the same problem persists: 83% of acquisitions fail to boost shareholder returns, and only 14% achieve significant success across strategic, operational, and financial measures simultaneously. Execution after close—not the deal itself—determines whether value is created or destroyed. For Indian PMI, statistics from public case studies and industry reports (McKinsey India, BCG India, PwC India Deals) show that programmatic acquirers achieve 10-year total shareholder returns 2 to 3x higher than one-off buyers. Regulatory timelines add complexity: Companies Act Section 230 schemes take 6 to 15 months for NCLT approval; SEBI SAST open offers add 90 to 140 days; CCI clearance adds 30 to 120 days; FEMA Form FC-GPR filings within 30 days of allotment. Cultural integration matters most in cross-border Indo-X deals where Indian working style (relationship-driven, hierarchical) must align with target-market styles (US task-driven, Japan consensus-based, Europe process-heavy).
The data from McKinsey, KPMG, Bain, Deloitte, and EY reveals that integration failures stem from execution breakdowns, not strategic misfit. Employee turnover hits 47% in Year 1, IT integrations fail or encounter major issues 84% of the time, and fewer than 1 in 5 acquirers improve IT costs post-close. Meanwhile, acquirers tracking synergies from Day 1 achieve 92% success rates.
This article compiles the most critical post-merger integration statistics for 2026, drawn from recent research, to help acquirers understand where value is created or destroyed after close—and what winning companies do differently.
TL;DR:
- 83% of M&A deals fail to boost shareholder returns; only 14% succeed across all measures
- 47% of employees leave within Year 1 of an acquisition—3.6x normal turnover
- 84% of IT integrations fail or experience significant issues, destroying 30–50% of deal value
- Acquirers tracking synergies from Day 1 achieve 92% success rates vs. baseline failure
- Successful acquirers invest 6%+ of deal value on integration
- Programmatic acquirers outperform peers by 2.3% TSR annually
Key Post-Merger Integration Statistics at a Glance
The baseline metrics reveal a severe gap between deal expectations and execution reality:
| PMI Metric | Statistic | Source |
|---|---|---|
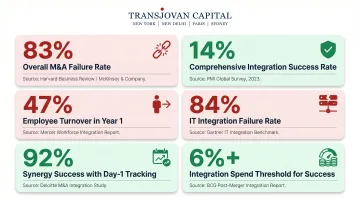
| Overall Failure Rate | 83% fail to boost shareholder returns | KPMG (2023) |
| Comprehensive Success | Only 14% achieve significant success across strategic, operational, and financial measures | PwC (2023) |
| Employee Turnover (Year 1) | 47% of employees leave within 12 months | EY (2025) |
| IT Integration Failure | 84% fail or experience significant issues | Gartner / PMI Stack (2024) |
| Synergy Success Rate | 92% success when synergies tracked from Day 1 | Global PMI Partners (2025) |
| Integration Spend | 78% of successful acquirers spend 6%+ of deal value | PwC (2023) |
The gap between 83% failure and 92% synergy success is not a matter of deal quality — it is a matter of execution discipline. Acquirers who invest adequately, track synergies from Day 1, and install dedicated integration leadership consistently outperform those who do not. Each statistic below carries the evidence behind that separation.
The Reality of Integration Failure: What the Data Says
Despite rigorous pre-deal valuation and strategic intent, the majority of M&A deals destroy shareholder value post-close.
KPMG's analysis of public-to-public M&A deals found that 57.2% of acquirers ultimately destroyed shareholder value — not just underperformed relative to sector benchmarks, but generated negative total shareholder return outright.
The reversal often begins immediately after close. Deals generate an average 13.2% TSR above the sector index in the lead-up to signing, then KPMG found TSR dropped an average of 7.4% in the two years following close. The pre-deal momentum evaporates once execution complexity sets in.
Comprehensive success remains rare. PwC's 2023 M&A Integration Survey defines "Successful M&A Organizations" as those reporting significant success across strategic, operational, and financial measures simultaneously. Only 14% of 2022 survey respondents qualified — and none from the 2019 cohort did.
The divergence between prepared and unprepared acquirers is measurable. Global PMI Partners' 2025 M&A Success Survey found that 70% of respondents rated their latest deals as successful or very successful — a striking contrast driven by whether acquirers entered integration with structured playbooks or improvised as they went.
That gap matters more as deal volumes climb. The M&A market rebounded sharply in 2025:
- Global deal values reached $4.9 trillion, up 40–49% year-over-year
- Megadeals (>$5B) surged 76%, from 63 in 2024 to 111 in 2025
- Q1 2026 deal value hit $1.2 trillion, up 26% quarter-over-quarter
Larger, more complex acquisitions amplify every integration risk. When the average megadeal involves multiple geographies, overlapping functions, and distinct cultures, the margin for ad-hoc execution narrows considerably. Structured PMI processes are not a differentiator at this volume — they are a prerequisite.
Why PMI Fails: Root Causes Behind the Numbers
When deals fail, executives blame strategic misfit or market conditions. The data proves otherwise: failures occur in the unglamorous work of combining two organizations.
Execution vs. Strategy: PMI Stack's research shows that **83% of practitioners cite poor integration execution** as the primary cause of failure, not strategic misfit. The deal thesis may be sound, but the operational work of merging systems, cultures, and processes determines whether value is created or destroyed.
Three Dominant Failure Themes
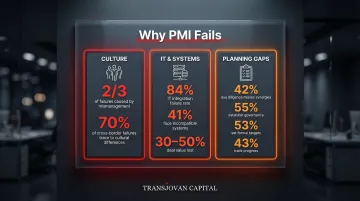
Culture: KPMG research finds that mismanaging people and cultures is the reason for two-thirds of failed transactions. Cultural misalignment is a direct driver of value erosion, not a peripheral people issue. In cross-border deals, 70% of failures trace back to cultural differences.
When leadership styles clash, decision-making stalls and employees disengage — and integration loses momentum before synergies are ever realised.
IT and Systems: 41% of integrations suffer from incompatible IT systems, and 32% identify data integration as the single biggest challenge. This connects directly to synergy capture: the majority of synergy initiatives are IT-dependent, meaning delayed or failed IT integration directly blocks value realization. Technology incompatibility, left unresolved, erodes deal value as surely as any strategic miscalculation.
Planning Gaps: 42% of due diligence processes fail to adequately identify synergies, leaving deal teams committing capital against unvalidated assumptions. The governance gaps compound this further:
- Only **55% of acquirers establish program governance**
- Just 53% set formal synergy targets
- A mere 43% implement tracking processes
Without these fundamentals in place, integration teams are managing by instinct rather than by plan.
The Synergy Validation Gap: Companies that track synergies from Day 1 achieve 92% success rates — a sharp contrast to the 83% baseline failure rate. The gap between those two numbers comes down to one thing: explicit targets, tracking processes, and clear ownership installed before the deal closes.
The Talent and People Problem: Retention Statistics
Acquisitions trigger a massive talent exodus. Uncertainty drives high performers to exit, severely impacting productivity and deal value.
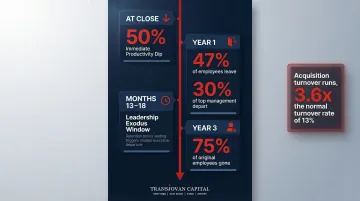
The Employee Turnover Reality: EY research shows that 47% of employees leave within Year 1 of an acquisition, and 75% are gone by Year 3. This compares to a baseline voluntary turnover rate of 13.0%—meaning acquisition-related turnover runs at 3.6 times the normal rate. The employees most likely to leave are high performers with alternatives—precisely the people acquirers cannot afford to lose.
Executive and Leadership Flight: The leadership exodus compounds the damage. 30% of top management depart in Year 1, with a median executive retention period of just 13–18 months.
Leadership departures happen at the moment of maximum organizational need—when institutional knowledge, decision-making authority, and cultural continuity matter most. Exits at the 13–18 month mark typically coincide with retention bonus vesting, creating a leadership vacuum at the most vulnerable tail-end of integration.
The Productivity Impact: Organizations experience a 50% productivity dip immediately post-close, with a sustained 25% drop persisting through integration. This drag stems from three compounding factors:
- Cultural uncertainty paralyzing day-to-day decision-making
- Unclear reporting lines slowing execution across teams
- Managerial churn disrupting continuity at every level
Most acquirers set retention budgets far too small relative to the talent at risk. They focus on synergy targets and cost cuts while underinvesting in the people responsible for delivering both.
IT Integration: The Silent Deal Killer
IT integration is consistently underestimated in M&A, leading to blown budgets, delayed synergies, and operational chaos.
The IT Failure Rate
84% of IT integrations fail or experience significant issues, and Gartner reports that 83% of data migration projects either fail outright or exceed their budgets and timelines. This isn't a risk to manage—it's a near-certainty to plan around.
30–50% of deal value is lost to slow or ineffective IT integration. Most synergy capture initiatives — ERP consolidation, system rationalization, data analytics — are IT-dependent. Delayed IT integration means delayed synergy realization. In many cases, those synergies never materialize at all.
The cost picture is worse still: fewer than 20% of acquirers improve IT costs post-merger. The complexity of consolidating systems, migrating data, and maintaining business continuity during integration typically drives costs higher, not lower — a dangerous mismatch between synergy promises and IT planning reality.
Realistic Integration Timelines
While executives push for 100-day integrations, full IT integration (unified ERP, consolidated CRM, migrated data) typically takes:
- 12–18 months for mid-sized deals
- 2–4 years for complex, R&D-heavy technology acquisitions
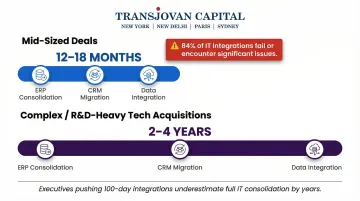
Acquirers who ignore these timelines face compounding integration failures — unrealistic synergy targets, operational disruption, and value erosion that undermines the original deal thesis.
What Successful Acquirers Do Differently
Winning acquirers treat integration as a core competency rather than a post-deal cleanup task. They invest heavily in dedicated leadership, early planning, and programmatic M&A capabilities.
The Dedicated Leadership Advantage
75% of acquirers achieved their strategic goals when a dedicated integration leader was present, yet the majority of companies still don't establish this role. Treating integration as a part-time add-on invariably costs more than the dedicated role would have. Successful acquirers appoint a named integration leader, often at the Managing Director or VP level, with clear authority and accountability.
The Programmatic Acquirer Advantage
McKinsey research shows that programmatic acquirers—companies that pursue at least two small or medium-size acquisitions annually—delivered median excess TSR of 2.3% over a ten-year period, outperforming selective acquirers, large-deal acquirers, and organic growth strategies. Programmatic acquirers also deliver 8.5% TSR growth compared to just 3.7% for ad-hoc acquirers.
Integration is a learnable, repeatable capability. The first acquisition is hard because you're building the muscle; by the fifth or tenth, you have playbooks, experienced teams, and institutional knowledge. Companies like Mahindra, Blackstone, and Legrand have built this discipline through serial acquisitions.
Most companies, however, aren't serial acquirers. For organizations that lack established integration infrastructure, Transjovan Capital's Corporate Development as a Service (CDaaS) model offers a structured alternative. Rather than building competence from scratch, the CDaaS model delivers a continuous, embedded Corporate Development engine spanning Strategy, Buy-Side M&A, Day-1 readiness, PMI, and Synergy Governance. Staffed by ex-Big-4 advisors and former CXOs, it functions as an extension of the acquirer's own team.
Integration Spend Benchmarks
PwC reports that 78% of Successful M&A Organizations spent 6%+ of deal value on integration, and this spend is rising year-over-year as companies realize the complexity of transformative deals. In 2022, 59% of companies spent 6% or more, compared to 38% previously.
Sector-specific benchmarks (as % of target revenue):
- Healthcare / Life Sciences: 10.1%
- Consumer: 7.5%
- Tech / Media / Telecom: 5.6%
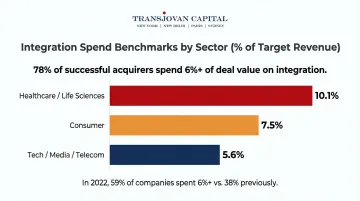
Healthcare requires the highest investment due to regulatory complexity and operational intricacies. Underfunding integration is one of the most common and costly mistakes in M&A execution—companies that scrimp on integration spend often blow past those savings through extended timelines, lost synergies, and talent attrition.
The Operating Model Planning Shift
PwC's research shows that 60% of companies planned their long-term operating model before due diligence concluded in 2022, up from just 25% in 2019. Notably, 41% of successful M&A organizations plan their operating model during the deal screening phase, before the letter of intent is even signed.
This is a meaningful structural shift. Early operating model planning covers reporting structures, leadership roles, technology architecture, and process design before close. It correlates directly with lower cost overruns and faster synergy realization.
Companies that defer these decisions until after close lose critical months and generate avoidable organizational churn. The question of how the combined entity will actually operate is too consequential to answer under post-deal pressure.
Indian Post-Merger Integration Statistics Landscape (2026)
PMI outcomes across Indian M&A are shaped by four measurable dimensions:
Regulatory timeline benchmarks: HDFC Ltd to HDFC Bank merger (India's largest, ₹40 lakh crore combined balance sheet): ~15 months from announcement (April 2022) to effectiveness (July 2023) via Companies Act Section 230 scheme. Adani Group acquisition of Ambuja Cements and ACC (approximately ₹80,000 crore combined): closed in September 2022 via mandatory SEBI SAST open offer post-Holcim exit, with multi-year operational integration. ArcelorMittal-Nippon Steel acquisition of Essar Steel at ₹42,000 crore: 21 months from CIRP admission (December 2017) to plan approval and closing (December 2019) via IBC. L&T-Mindtree merger at ~₹8,400 crore (2022): 14 months from announcement to statutory effectiveness via scheme of arrangement.
Cross-border cultural integration outcomes: Tata Motors and Jaguar Land Rover (Indo-UK, 2008, approximately ₹9,300 crore or $2.3 billion): landmark cross-border deal with strong operational autonomy for JLR post-acquisition, preserving UK design and engineering culture while leveraging Tata capital. Hindalco acquisition of Aleris (Indo-US, 2020, approximately ₹18,500 crore or $2.6 billion): downstream aluminum integration with US and European operations. Sun Pharma acquisition of Ranbaxy (2014): complex Indian pharma integration involving FDA-related warning letter remediation. Common Indo-X cultural integration failure modes include over-imposing Indian working style on target-market operations, and inadequate retention of target-side senior management.
Synergy capture ratios: McKinsey India research (2023) shows Indian acquirers capturing 45 to 75% of announced synergies within 24 months, with programmatic acquirers (Adani, Tata, Reliance, L&T) at the upper end. One-off buyers frequently deliver 30 to 50% of announced synergies. Key drivers of high capture: dedicated Corporate Development function (or embedded CDaaS partner), 100-day integration plan formalized pre-signing, and CFO-driven synergy tracking.
Talent retention benchmarks: BCG India research (2024) shows Indian M&A deals with 75%+ retention of top-100 target executives (18 months post-close) deliver 2.5x higher total return than deals with less than 50% retention. Cross-border Indo-X deals require 24 to 36 month lock-ins with performance-linked ESOPs; domestic deals typically require 12 to 18 month retention structures.
Regulatory instruments critical to PMI planning: SEBI (SAST) open offer completion window, Companies Act Sections 230 to 232 NCLT approval, IBC resolution plan implementation, FEMA Form FC-GPR and Form FC-TRS filings, GST re-registration for state consolidation, Ind AS 103 purchase price allocation, and specific state stamp duty on immovable property transfers.
Focus sectors within Transjovan's coverage where PMI expertise matters most include industrials, manufacturing, chemicals, engineering, automotive, semiconductors, and financial services. Applicable corridors: Indo-US, Indo-Japan, Indo-French, Indo-German, Indo-Italian, Indo-Australian, and Indo-European.
Frequently Asked Questions
What is the success rate of post-merger integration?
M&A failure rates consistently fall between 60% and 90%. KPMG reports that 83% of deals fail to boost shareholder returns, with 57.2% actively destroying shareholder value. Companies using structured integration processes—dedicated leadership, synergy tracking from Day 1, and adequate investment—achieve success at significantly higher rates, with some studies showing 70%+ success for disciplined acquirers.
What are the 4 types of integration?
The four integration types, defined by Haspeslagh & Jemison (1991), are: absorption (full consolidation into acquirer), preservation (target remains largely independent), symbiosis (selective integration of best capabilities from both), and holding (minimal integration, portfolio management). The right choice depends on deal rationale, strategic objectives, and the required level of organizational autonomy.
What does an IT system integrator do in M&A?
An IT system integrator harmonizes the technology infrastructure of two merging companies by consolidating ERP/CRM systems, migrating data, rationalizing software licenses, and maintaining business continuity. It is one of the highest-risk integration workstreams: 84% of IT integrations encounter significant issues, and slow or ineffective IT work accounts for 30–50% of lost deal value.
What are the main reasons post-merger integrations fail?
The top three research-backed failure causes are:
- Poor integration execution — cited by 83% of practitioners
- Cultural misalignment — responsible for two-thirds of failed transactions
- IT/systems incompatibility — affects 41% of deals
Strategic misfit is rarely the primary culprit. Most deals fail in the operational work of combining two organizations, not in the strategic thesis.
How long does post-merger integration typically take?
Full integration typically takes 12–18 months for mid-sized deals and 2–3+ years for large or complex cross-border transactions. These timelines assume active integration management; deals lacking dedicated PMO support routinely run over by 6–12 months and capture significantly less synergy value.
What percentage of Indian M&A deals fail to deliver expected synergies?
Studies consistently show that 60 to 70% of global M&A deals fail to deliver announced synergies within 2 to 3 years, and Indian data mirrors this range. Specific patterns: PMI regulatory delays for Companies Act Section 230 schemes (NCLT approval 6 to 15 months) can extend integration windows and dilute synergy capture; cultural misfit in cross-border Indo-X deals is a top failure driver; over-optimistic synergy targets at announcement consistently disappoint (McKinsey research shows median synergy capture is 60 to 75% of announced targets); talent attrition at the target company correlates strongly with underperformance. Programmatic Indian acquirers (Adani, Tata, Reliance, L&T) consistently outperform, delivering synergies at 75 to 100% of announced targets by using dedicated Corporate Development teams, standardized 100-day integration playbooks, and CFO-driven synergy tracking.
What are the typical Indian PMI regulatory timelines?
Indian PMI regulatory timelines vary by deal structure and complexity: Share Purchase Agreement (SPA) with immediate closure: 100-day sprint plus 12 to 24 month deep integration. Companies Act Section 230 scheme of arrangement: 6 to 15 months for NCLT approval before effective date (HDFC-HDFC Bank merger took approximately 15 months). SEBI SAST open offer completion window for listed acquisitions: approximately 140 days. CCI merger notification and clearance: 30 working days (Phase I) or up to 120 working days (Phase II for complex reviews). IBC resolution plan acquisitions: 180 to 330 days from CIRP admission to plan approval and closing (Essar Steel acquisition took 21 months). Cross-border Indo-X deals: typically 6 to 12 months additional for target-market regulatory clearances (US CFIUS, EU merger control, Japanese FEFTA, Australian FIRB). Advisors typically build a 4-phase PMI plan: Pre-close, Day 1, 100-Day Plan, and 12 to 24 Month Deep Integration.
Which Indian M&A cases are the best PMI benchmarks?
The best Indian PMI benchmark case studies span domestic and cross-border deals. Domestic large-cap: HDFC Ltd to HDFC Bank merger (India's largest at ₹40 lakh crore combined) executed under Companies Act Section 230 with strong pre-planning; L&T-Mindtree merger (~₹8,400 crore) delivered technology services consolidation. Cross-border outbound: Tata Motors-Jaguar Land Rover (Indo-UK, 2008) demonstrated operational-autonomy PMI model that preserved UK design and engineering culture while leveraging Indian capital; Hindalco-Aleris (Indo-US, 2020) showcased downstream aluminum integration. Distressed acquisition via IBC: ArcelorMittal-Nippon Steel-Essar Steel (Indo-Japan and Indo-European, ₹42,000 crore) showed multi-party creditor resolution plus operational stabilization. Transjovan Capital serves Indian PMI mandates across Indo-US, Indo-Japan, Indo-French, Indo-German, Indo-Italian, Indo-Australian, and Indo-European corridors and 16 focus sectors (semiconductors, electronics, industrials, manufacturing, data centres, engineering, automotive, chemicals, packaging, electric vehicles, energy transition, AI infrastructure, deeptech, food & beverage, agrochemicals, and building materials) via its CDaaS model.